

As you know, since the Waldo Canyon fire hit in June, 2012, Colorado Springs has been hard at work rebuilding. Stauffer & Sons has been a part of rebuilding after this fire (and the Black Forest fire), and many people have asked us over the past few months how the overall rebuilding effort has been going. So today, we wanted to share some numbers and information about the homes that have been rebuilt, how many are left, and more. We hope you find this info helpful.

One of the 11 homes we built, before and after construction
The Waldo Canyon fire burned 346 homes, and so far (as of 09/30/14), 276 permits have been issued to rebuild, leaving a grand total of 70 homes that have not been rebuilt as of this date. That means just under two and a half years after the fire, the Mountain Shadows area is now 79.8% rebuilt! This is great news for our community. Stauffer & Sons was privileged to have made the list of builders who have built the most homes (we’re number 5)!
Home Values:
- Most expensive home: $1.3MM
- Least expensive home: $147,000
- Median home value: $392,501
- Value of all homes: $112.8MM
Top Builders:
- Classic Homes: 37
- Vantage Homes: 36
- CR Shea Homes: 15
- Saddletree Homes: 12
- Stauffer & Sons Construction: 11
Other Stats:
- Time since fire: 2 yrs/4 mo
- Total home builders: 77
- Homes built by homeowners: 8
- Total homes rebuilt: 276
- Homes remaining: 70

More than 79% rebuilt, and still building!
There are a few reasons why the remaining 70 homes haven’t been built yet: some of the families who lost their homes decided to sell their lot and move somewhere else (sometimes to another place in town, other times, to a different state). Others have not decided whether to build or not, and are still working through the process.
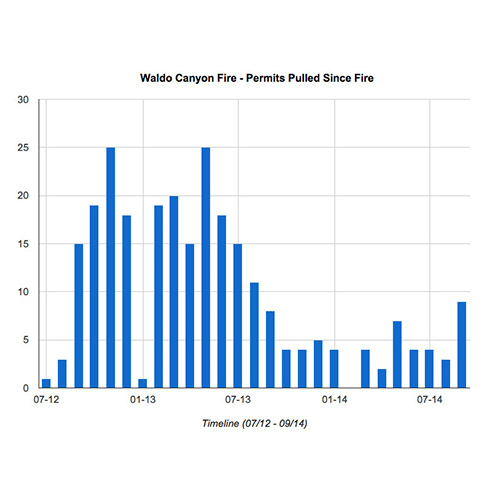
The chart below shows the number of permits pulled over time, and you can see the trend that you might expect: most of the families who decided to rebuild moved pretty quickly, (65% of the permits pulled were done so within the first year after the fire). Since then, there’s been a slow trickle of permits pulled just about each month, even to this day (nine permits in September).

The Waldo Canyon fire was interesting, in that it destroyed over 18,000 acres of land, but the actual area within city limits where the homes were burned only covered about 1.5 square miles. Due to this, most of the homes affected were located in a tightly-packed radius. For example, the “epicenter” of the fire was right in the Parkside Neighborhood, where 141 of the 171 homes in the neighborhood were lost. (This is in contrast with the Black Forest fire, where fewer overall acres were burned, but the fire damaged homes across a 15 square mile area).
Below is a map of all the homes that were destroyed. Homes rebuilt are in marked in red, homes not rebuilt are marked in orange, and the blue shape is the Parkside area.
(To use the map, click anywhere and drag to move the map around, and use the +/- button on the bottom right to zoom in and out.)
We’re excited to see our city coming back after the Waldo Canyon fire, and we’re watching the recovery from the Black Forest fire with anticipation as well. We’ve enjoyed working with some wonderful people (such as the Pati Family and Rose Family whose stories you can read online), and we hope the rebuilding efforts will make it so that 5-10 years from now, you wouldn’t even notice that there was a fire at all. We’ll keep you updated on the progress of rebuilding from both fires. Stay tuned for statistics on Black Forest, which we’ll share soon. Here’s to wishing the the very best in the recovery of our community!

The beautiful new sign at Parkside
Note: all charts and statistics based on raw data taken from Pikes Peak Regional Building Department, fetched 10/02/14. If you would like a more detailed look at these charts, maps, or data, feel free to contact us.


0 Comments